
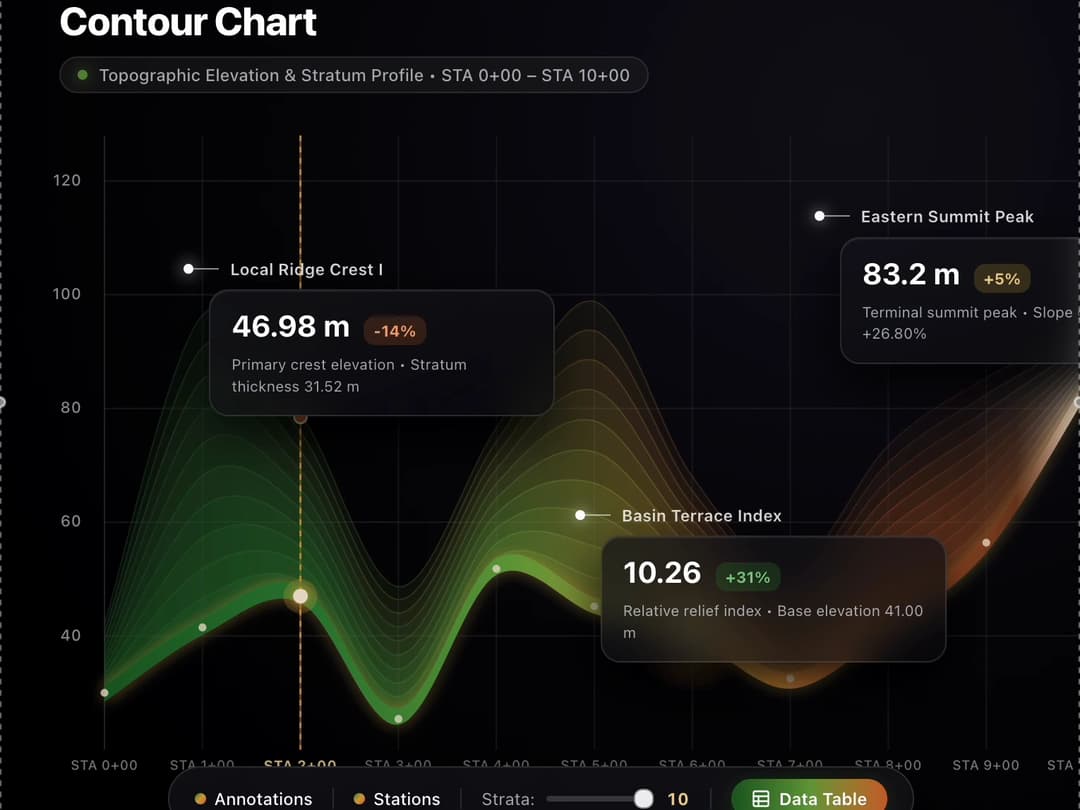
About
component that renders an interactive, full-viewport topographic Contour Chart dashboard against an obsidian black background.
Built with React and Tailwind. Copy the prompt and paste it into Claude Code, Cursor or Lovable: your agent adds Contour Line Chart to your project and fits it to your theme.
Code
How Contour Line Chart is used: the demo's code. The component's own source comes with a free account.
Usage.tsx
import React, { useState, useEffect, useRef, useCallback } from 'react';
interface StationPoint {
sta: string;
dist: number;
base: number;
top: number;
slope: number;
morph: string;
}
interface Point2D {
x: number;
y: number;
}
const INITIAL_STATIONS: StationPoint[] = [
{ sta: 'STA 0+00', dist: 0, base: 30.00, top: 42.0, slope: 0.00, morph: 'Initial Foothill' },
{ sta: 'STA 1+00', dist: 100, base: 41.50, top: 96.0, slope: 11.50, morph: 'Primary Ridge I' },
{ sta: 'STA 2+00', dist: 200, base: 46.98, top: 78.5, slope: 5.48, morph: 'Local Ridge Crest I' },
{ sta: 'STA 3+00', dist: 300, base: 25.40, top: 48.0, slope: -21.58, morph: 'Steep Valley Depression' },
{ sta: 'STA 4+00', dist: 400, base: 51.80, top: 76.0, slope: 26.40, morph: 'Central Plateau' },
{ sta: 'STA 5+00', dist: 500, base: 45.20, top: 98.5, slope: -6.60, morph: 'Upper Stratum Peak II' },
{ sta: 'STA 6+00', dist: 600, base: 41.00, top: 68.0, slope: -4.20, morph: 'Basin Terrace' },
{ sta: 'STA 7+00', dist: 700, base: 32.50, top: 52.0, slope: -8.50, morph: 'Secondary Valley' },
{ sta: 'STA 8+00', dist: 800, base: 42.80, top: 74.0, slope: 10.30, morph: 'Ascending Eastern Slope' },
{ sta: 'STA 9+00', dist: 900, base: 56.40, top: 86.0, slope: 13.60, morph: 'Upper Escarpment' },
{ sta: 'STA 10+00', dist: 1000, base: 83.20, top: 94.0, slope: 26.80, morph: 'Eastern Summit Peak' }
];
const Y_TICKS = [120, 100, 80, 60, 40];
const Y_MIN = 20;
const Y_MAX = 128;
function formatNum(num: number, decimals = 2): string {
return Number(num).toLocaleString('en-US', {
minimumFractionDigits: decimals,
maximumFractionDigits: decimals,
});
}
function computeCatmullRom(points: Point2D[], segments = 26): Point2D[] {
if (points.length < 2) return points;
const result: Point2D[] = [];
for (let i = 0; i < points.length - 1; i++) {
const p0 = points[i === 0 ? i : i - 1];
const p1 = points[i];
const p2 = points[i + 1];
const p3 = points[i + 2 < points.length ? i + 2 : i + 1];
for (let s = 0; s < segments; s++) {
const t = s / segments;
const t2 = t * t;
const t3 = t2 * t;
const x =
0.5 *
(2 * p1.x +
(-p0.x + p2.x) * t +
(2 * p0.x - 5 * p1.x + 4 * p2.x - p3.x) * t2 +
(-p0.x + 3 * p1.x - 3 * p2.x + p3.x) * t3);
const y =
0.5 *
(2 * p1.y +
(-p0.y + p2.y) * t +
(2 * p0.y - 5 * p1.y + 4 * p2.y - p3.y) * t2 +
(-p0.y + 3 * p1.y - 3 * p2.y + p3.y) * t3);
result.push({ x, y });
}
}
result.push(points[points.length - 1]);
return result;
}
export default function App() {
const [stations, setStations] = useState<StationPoint[]>(INITIAL_STATIONS);
const [layers, setLayers] = useState<number>(8);
const [showAnnotations, setShowAnnotations] = useState<boolean>(true);
const [showStations, setShowStations] = useState<boolean>(true);
const [hoveredIdx, setHoveredIdx] = useState<number | null>(null);
const [pinnedIdx, setPinnedIdx] = useState<number | null>(null);
const [tooltipPos, setTooltipPos] = useState<{ x: number; y: number }>({ x: 0, y: 0 });
const [isTableOpen, setIsTableOpen] = useState<boolean>(false);
const [searchQuery, setSearchQuery] = useState<string>('');
const [slopeFilter, setSlopeFilter] = useState<'all' | 'ascending' | 'descending'>('all');
const [toastMsg, setToastMsg] = useState<string | null>(null);
const stageRef = useRef<HTMLDivElement | null>(null);
const canvasRef = useRef<HTMLCanvasElement | null>(null);
const phaseRef = useRef<number>(0);
const dimsRef = useRef<{ width: number; height: number; padLeft: number; padBottom: number }>({
width: 800,
height: 450,
padLeft: 76,
padBottom: 74,
});
// Keep latest state accessible inside the 60fps animation frame loop without restarting it
const renderStateRef = useRef({
stations,
layers,
showStations,
hoveredIdx,
pinnedIdx,
});
useEffect(() => {
renderStateRef.current = {
stations,
layers,
showStations,
hoveredIdx,
pinnedIdx,
};
}, [stations, layers, showStations, hoveredIdx, pinnedIdx]);
const triggerToast = useCallback((msg: string) => {
setToastMsg(msg);
}, []);
useEffect(() => {
if (!toastMsg) return;
const timer = setTimeout(() => setToastMsg(null), 2400);
return () => clearTimeout(timer);
}, [toastMsg]);
const idxToX = useCallback((idx: number, totalCount: number) => {
const { width, padLeft } = dimsRef.current;
const plotW = Math.max(100, width - padLeft);
return padLeft + (idx / Math.max(1, totalCount - 1)) * plotW;
}, []);
const elevToY = useCallback((elev: number) => {
const { height, padBottom } = dimsRef.current;
const padTop = 20;
const plotH = Math.max(100, height - padTop - padBottom);
const norm = (elev - Y_MIN) / (Y_MAX - Y_MIN);
return padTop + plotH * (1 - norm);
}, []);
// Canvas resize & high-DPI scaling
useEffect(() => {
const stage = stageRef.current;
const canvas = canvasRef.current;
if (!stage || !canvas) return;
const ctx = canvas.getContext('2d');
if (!ctx) return;
const handleResize = () => {
const rect = stage.getBoundingClientRect();
const width = Math.max(300, rect.width || window.innerWidth);
const height = Math.max(340, rect.height || 440);
const padLeft = width < 640 ? 48 : 76;
const padBottom = width < 768 ? 28 : 74;
dimsRef.current = { width, height, padLeft, padBottom };
const dpr = Math.min(window.devicePixelRatio || 1, 2);
canvas.width = Math.round(width * dpr);
canvas.height = Math.round(height * dpr);
ctx.setTransform(dpr, 0, 0, dpr, 0, 0);
};
handleResize();
let ro: ResizeObserver | null = null;
if (typeof ResizeObserver !== 'undefined') {
ro = new ResizeObserver(handleResize);
ro.observe(stage);
}
window.addEventListener('resize', handleResize);
return () => {
if (ro) ro.disconnect();
window.removeEventListener('resize', handleResize);
};
}, []);
// Main Canvas animation loop
useEffect(() => {
const canvas = canvasRef.current;
if (!canvas) return;
const ctx = canvas.getContext('2d');
if (!ctx) return;
let animId = 0;
const getSoilHypsometricGradient = (alpha: number, layerRatio: number, width: number, padLeft: number) => {
const grad = ctx.createLinearGradient(padLeft, 0, Math.max(width, padLeft + 10), 0);
if (layerRatio > 0.72) {
grad.addColorStop(0.0, `rgba(46, 125, 50, ${alpha})`);
grad.addColorStop(0.24, `rgba(104, 159, 56, ${alpha})`);
grad.addColorStop(0.48, `rgba(212, 163, 56, ${alpha})`);
grad.addColorStop(0.72, `rgba(200, 100, 40, ${alpha})`);
grad.addColorStop(0.88, `rgba(109, 56, 26, ${alpha})`);
grad.addColorStop(1.0, `rgba(232, 220, 200, ${alpha})`);
} else {
grad.addColorStop(0.0, `rgba(27, 94, 32, ${alpha})`);
grad.addColorStop(0.22, `rgba(46, 125, 50, ${alpha})`);
grad.addColorStop(0.42, `rgba(104, 159, 56, ${alpha})`);
grad.addColorStop(0.62, `rgba(212, 163, 56, ${alpha})`);
grad.addColorStop(0.80, `rgba(200, 100, 40, ${alpha})`);
grad.addColorStop(0.93, `rgba(109, 56, 26, ${alpha})`);
grad.addColorStop(1.0, `rgba(232, 220, 200, ${alpha})`);
}
return grad;
};
const drawFrame = () => {
const { width, height, padLeft, padBottom } = dimsRef.current;
const padTop = 20;
const bottom = height - padBottom;
const { stations: stList, layers: layerCount, showStations: showPts, hoveredIdx: hov, pinnedIdx: pin } =
renderStateRef.current;
ctx.clearRect(0, 0, width, height);
// 1. Draw Grid and Axes
ctx.save();
ctx.font = "500 11px 'Plus Jakarta Sans', system-ui, sans-serif";
ctx.textAlign = 'right';
ctx.textBaseline = 'middle';
Y_TICKS.forEach((tick) => {
const y = elevToY(tick);
ctx.fillStyle = 'rgba(226, 228, 240, 0.65)';
ctx.fillText(String(tick), padLeft - 16, y);
ctx.beginPath();
ctx.moveTo(padLeft, y);
ctx.lineTo(width, y);
ctx.strokeStyle = 'rgba(255, 255, 255, 0.08)';
ctx.lineWidth = 1;
ctx.stroke();
});
ctx.textAlign = 'center';
ctx.textBaseline = 'top';
const labelStep = width < 640 ? 2 : 1;
stList.forEach((st, idx) => {
const x = idxToX(idx, stList.length);
const isActive = idx === hov || idx === pin;
ctx.beginPath();
ctx.moveTo(x, padTop);
ctx.lineTo(x, bottom);
ctx.strokeStyle = isActive
? 'rgba(212, 163, 56, 0.5)'
: idx === 0
? 'rgba(255, 255, 255, 0.14)'
: 'rgba(255, 255, 255, 0.06)';
ctx.lineWidth = isActive ? 1.4 : 1;
ctx.stroke();
if (showPts && (idx % labelStep === 0 || isActive)) {
ctx.fillStyle = isActive ? '#ebd08b' : 'rgba(226, 228, 240, 0.56)';
ctx.font = isActive
? "700 10px 'Plus Jakarta Sans', system-ui, sans-serif"
: "500 9.5px 'Plus Jakarta Sans', system-ui, sans-serif";
ctx.fillText(st.sta, x, bottom + 7);
}
});
ctx.restore();
// 2. Draw Hypsometric Contour Strata
const baseNodes = stList.map((st, idx) => {
const subtleWave = Math.sin(phaseRef.current * 1.1 + idx * 0.65) * 0.42;
return { x: idxToX(idx, stList.length), y: elevToY(st.base + subtleWave) };
});
const smoothBase = computeCatmullRom(baseNodes, 26);
if (smoothBase.length >= 2) {
for (let layer = layerCount; layer >= 1; layer--) {
const ratio = layer / layerCount;
const alpha = 0.065 + (1 - ratio) * 0.125;
const layerNodes = stList.map((st, idx) => {
const drift = Math.cos(phaseRef.current * 0.9 + idx * 0.5 + layer * 0.35) * 0.65;
const elev = st.base + (st.top - st.base) * ratio + drift;
return { x: idxToX(idx, stList.length), y: elevToY(elev) };
});
const smoothLayer = computeCatmullRom(layerNodes, 26);
ctx.save();
ctx.beginPath();
smoothLayer.forEach((pt, i) => {
if (i === 0) ctx.moveTo(pt.x, pt.y);
else ctx.lineTo(pt.x, pt.y);
});
for (let i = smoothBase.length - 1; i >= 0; i--) {
ctx.lineTo(smoothBase[i].x, smoothBase[i].y);
}
ctx.closePath();
ctx.fillStyle = getSoilHypsometricGradient(alpha, ratio, width, padLeft);
ctx.fill();
ctx.beginPath();
smoothLayer.forEach((pt, i) => {
if (i === 0) ctx.moveTo(pt.x, pt.y);
else ctx.lineTo(pt.x, pt.y);
});
ctx.strokeStyle = getSoilHypsometricGradient(0.24 + (1 - ratio) * 0.18, ratio, width, padLeft);
ctx.lineWidth = 0.9;
ctx.stroke();
ctx.restore();
}
// Core Terrain Profile Ribbon
ctx.save();
const ribbonHalf = Math.max(5.5, height * 0.011);
ctx.beginPath();
smoothBase.forEach((pt, i) => {
if (i === 0) ctx.moveTo(pt.x, pt.y - ribbonHalf);
else ctx.lineTo(pt.x, pt.y - ribbonHalf);
});
for (let i = smoothBase.length - 1; i >= 0; i--) {
ctx.lineTo(smoothBase[i].x, smoothBase[i].y + ribbonHalf);
}
ctx.closePath();
ctx.shadowColor = 'rgba(212, 163, 56, 0.52)';
ctx.shadowBlur = 20;
ctx.fillStyle = getSoilHypsometricGradient(1, 0, width, padLeft);
ctx.fill();
ctx.restore();
// Mineral / Limestone Flare at Inflection Point (STA 6+00)
const inflectionNode = baseNodes[6];
if (inflectionNode) {
ctx.save();
const flare = ctx.createRadialGradient(
inflectionNode.x,
inflectionNode.y,
1,
inflectionNode.x,
inflectionNode.y,
44
);
flare.addColorStop(0, 'rgba(232, 220, 200, 0.88)');
flare.addColorStop(0.38, 'rgba(212, 163, 56, 0.36)');
flare.addColorStop(1, 'rgba(200, 100, 40, 0)');
ctx.fillStyle = flare;
ctx.beginPath();
ctx.arc(inflectionNode.x, inflectionNode.y, 44, 0, Math.PI * 2);
ctx.fill();
ctx.restore();
}
// Station Markers & Active Crosshair
stList.forEach((st, idx) => {
const x = idxToX(idx, stList.length);
const yBase = elevToY(st.base);
const yTop = elevToY(st.top);
const isActive = idx === hov || idx === pin;
if (isActive) {
ctx.save();
ctx.beginPath();
ctx.moveTo(x, padTop);
ctx.lineTo(x, bottom);
ctx.strokeStyle = 'rgba(212, 163, 56, 0.8)';
ctx.setLineDash([4, 4]);
ctx.lineWidth = 1.4;
ctx.stroke();
ctx.setLineDash([]);
ctx.beginPath();
ctx.arc(x, yTop, 4.5, 0, Math.PI * 2);
ctx.fillStyle = '#c86428';
ctx.fill();
ctx.strokeStyle = '#e8dcc8';
ctx.lineWidth = 1.5;
ctx.stroke();
ctx.beginPath();
ctx.arc(x, yBase, 12, 0, Math.PI * 2);
ctx.fillStyle = 'rgba(212, 163, 56, 0.28)';
ctx.fill();
ctx.restore();
}
if (showPts || isActive) {
ctx.save();
ctx.beginPath();
ctx.arc(x, yBase, isActive ? 5.2 : 2.8, 0, Math.PI * 2);
ctx.fillStyle = isActive ? '#e8dcc8' : 'rgba(232, 220, 200, 0.8)';
if (isActive) {
ctx.shadowColor = '#d4a338';
ctx.shadowBlur = 12;
}
ctx.fill();
ctx.restore();
}
});
}
phaseRef.current += 0.015;
animId = requestAnimationFrame(drawFrame);
};
animId = requestAnimationFrame(drawFrame);
return () => cancelAnimationFrame(animId);
}, [elevToY, idxToX]);
const handlePointerMove = (clientX: number) => {
const canvas = canvasRef.current;
if (!canvas) return;
const rect = canvas.getBoundingClientRect();
const relX = clientX - rect.left;
const { width, height } = dimsRef.current;
let nearestIdx = 0;
let minDistance = Infinity;
stations.forEach((_, idx) => {
const dist = Math.abs(idxToX(idx, stations.length) - relX);
if (dist < minDistance) {
minDistance = dist;
nearestIdx = idx;
}
});
if (minDistance > 62) {
setHoveredIdx(null);
return;
}
setHoveredIdx(nearestIdx);
const st = stations[nearestIdx];
const sx = idxToX(nearestIdx, stations.length);
const sy = elevToY(st.base);
const boxW = 248;
const posX = sx + boxW + 24 > width ? Math.max(12, sx - boxW - 14) : sx + 16;
const posY = Math.max(12, Math.min(height - 185, sy - 70));
setTooltipPos({ x: posX, y: posY });
};
const handlePinStation = (idx: number) => {
setPinnedIdx((prev) => {
const next = prev === idx ? null : idx;
triggerToast(
next !== null
? `Pinned ${stations[idx].sta} (${stations[idx].morph})`
: 'Station selection cleared'
);
return next;
});
};
const handleElevationEdit = (idx: number, field: 'base' | 'top', rawValue: string) => {
const parsed = parseFloat(rawValue);
if (Number.isNaN(parsed)) return;
const clamped = Math.max(0, Math.min(130, parsed));
setStations((prev) => {
const updated = prev.map((item, i) => {
if (i !== idx) return { ...item };
const nextItem = { ...item, [field]: clamped };
if (field === 'base' && nextItem.base > nextItem.top) {
nextItem.top = nextItem.base;
} else if (field === 'top' && nextItem.top < nextItem.base) {
nextItem.base = nextItem.top;
}
return nextItem;
});
for (let i = 1; i < updated.length; i++) {
const dElev = updated[i].base - updated[i - 1].base;
const dDist = updated[i].dist - updated[i - 1].dist;
updated[i].slope = dDist > 0 ? (dElev / dDist) * 100 : 0;
}
return updated;
});
};
const handleResetDataset = () => {
setStations(INITIAL_STATIONS.map((s) => ({ ...s })));
setPinnedIdx(null);
setSearchQuery('');
setSlopeFilter('all');
triggerToast('Dataset restored to default survey values');
};
const handleDownloadCsv = () => {
const headers = [
'station',
'distance_m',
'base_elevation_m',
'contour_crest_m',
'stratum_thickness_m',
'slope_grade_pct',
'landform_morphology',
];
const rows = stations.map((st) =>
[
st.sta,
st.dist,
st.base.toFixed(2),
st.top.toFixed(2),
(st.top - st.base).toFixed(2),
st.slope.toFixed(2),
`"${st.morph}"`,
].join(',')
);
const csvContent = 'data:text/csv;charset=utf-8,' + [headers.join(','), ...rows].join('\n');
const link = document.createElement('a');
link.setAttribute('href', encodeURI(csvContent));
link.setAttribute('download', 'topographic_contour_chart_sta_0_10.csv');
document.body.appendChild(link);
link.click();
document.body.removeChild(link);
triggerToast('CSV dataset downloaded successfully');
};
const hoveredStation = hoveredIdx !== null ? stations[hoveredIdx] : null;
const st2 = stations[2];
const st6 = stations[6];
const st10 = stations[10];
const baseValues = stations.map((s) => s.base);
const minElev = Math.min(...baseValues);
const maxElev = Math.max(...baseValues);
const avgElev = baseValues.reduce((acc, v) => acc + v, 0) / stations.length;
const maxThickness = Math.max(...stations.map((s) => s.top - s.base));
const filteredStations = stations
.map((st, idx) => ({ st, idx }))
.filter(({ st }) => {
const q = searchQuery.trim().toLowerCase();
const matchesQuery =
!q ||
st.sta.toLowerCase().includes(q) ||
st.morph.toLowerCase().includes(q) ||
String(st.dist).includes(q);
const matchesSlope =
slopeFilter === 'all' ||
(slopeFilter === 'ascending' && st.slope > 0) ||
(slopeFilter === 'descending' && st.slope < 0);
return matchesQuery && matchesSlope;
});
const getSoilZoneBadge = (elev: number) => {
if (elev < 35) {
return {
label: 'Lowland Valley',
dot: '#2e7d32',
cls: 'border-[#2e7d32]/40 bg-[#2e7d32]/20 text-[#81c784]',
};
}
if (elev < 55) {
return {
label: 'Ochre Terrace',
dot: '#d4a338',
cls: 'border-[#d4a338]/40 bg-[#d4a338]/20 text-[#ebd08b]',
};
}
return {
label: 'Summit Escarpment',
dot: '#c86428',
cls: 'border-[#c86428]/40 bg-[#c86428]/20 text-[#f0a875]',
};
};
return (
<div className="relative flex min-h-screen w-full flex-col justify-between overflow-x-hidden bg-[radial-gradient(circle_at_78%_18%,#0e0e16_0%,#050508_46%,#000000_100%)] text-white antialiased select-none md:h-screen md:overflow-hidden">
{/* TOP LEFT HEADER */}
<header className="relative z-20 flex flex-shrink-0 items-start justify-between px-6 pt-6 pb-2 sm:px-11 sm:pt-8 sm:pb-2.5">
<div>
<h1 className="text-[clamp(1.75rem,2.8vw,2.35rem)] font-extrabold leading-[1.1] tracking-[-0.025em] text-white">
Contour Chart
</h1>
<div className="mt-2.5 inline-flex items-center gap-2 rounded-full border border-white/12 bg-white/5 px-3 py-1 text-xs font-medium text-slate-200/75">
<span className="h-[7px] w-[7px] animate-pulse rounded-full bg-[#689f38] shadow-[0_0_10px_#689f38]" />
<span>Topographic Elevation & Stratum Profile • STA 0+00 – STA 10+00</span>
</div>
</div>
</header>
{/* MAIN CONTOUR WAVE VISUALIZATION */}
<section className="relative flex min-h-[430px] w-full flex-1 flex-col justify-end md:min-h-0">
<div ref={stageRef} className="relative h-full min-h-[400px] w-full md:min-h-0">
<canvas
ref={canvasRef}
onMouseMove={(e) => handlePointerMove(e.clientX)}
onMouseLeave={() => setHoveredIdx(null)}
onClick={() => {
if (hoveredIdx !== null) handlePinStation(hoveredIdx);
}}
onTouchMove={(e) => {
if (e.touches && e.touches[0]) handlePointerMove(e.touches[0].clientX);
}}
onTouchEnd={() => setHoveredIdx(null)}
className="block h-full w-full cursor-crosshair touch-pan-y"
/>
{/* DESKTOP ANNOTATION CALLOUT CARDS */}
{showAnnotations && (
<>
{/* CARD 1: STA 2+00 */}
<div
onClick={() => handlePinStation(2)}
style={{ left: '19.5%', top: '20%' }}
className="group absolute z-15 hidden w-[245px] cursor-pointer transition-all duration-200 md:block"
>
<div className="-ml-[18px] mb-1.5 flex items-center">
<span className="h-[7px] w-[7px] flex-shrink-0 rounded-full bg-white shadow-[0_0_10px_rgba(255,255,255,0.9)]" />
<span className="h-px w-[18px] flex-shrink-0 bg-white/60" />
<span className="ml-2 whitespace-nowrap text-[11.5px] font-semibold tracking-[0.01em] text-white/90">
Local Ridge Crest I
</span>
</div>
<div className="rounded-[14px] border border-white/14 bg-gradient-to-br from-[#14141c]/75 to-[#08080c]/65 px-[15px] py-[13px] shadow-[0_14px_36px_rgba(0,0,0,0.85),inset_0_1px_0_rgba(255,255,255,0.07)] backdrop-blur-md transition-all duration-200 group-hover:-translate-y-0.5 group-hover:border-[#d4a338]/65 group-hover:shadow-[0_18px_40px_rgba(0,0,0,0.92),0_0_24px_rgba(200,100,40,0.22)]">
<div className="flex items-baseline gap-2.5">
<span className="text-[21px] font-bold leading-[1.1] text-white">
{formatNum(st2.base)} m
</span>
<span className="rounded-md bg-[#c86428]/25 px-[7px] py-[2px] text-[11px] font-bold text-[#f0a875]">
-14%
</span>
</div>
<p className="mt-1.5 text-[10.5px] leading-[1.45] text-slate-200/75">
Primary crest elevation • Stratum thickness {formatNum(st2.top - st2.base)} m
</p>
</div>
</div>
{/* CARD 2: STA 6+00 */}
<div
onClick={() => handlePinStation(6)}
style={{ left: '55.5%', top: '53%' }}
className="group absolute z-15 hidden w-[245px] cursor-pointer transition-all duration-200 md:block"
>
<div className="-ml-[18px] mb-1.5 flex items-center">
<span className="h-[7px] w-[7px] flex-shrink-0 rounded-full bg-white shadow-[0_0_10px_rgba(255,255,255,0.9)]" />
<span className="h-px w-[18px] flex-shrink-0 bg-white/60" />
<span className="ml-2 whitespace-nowrap text-[11.5px] font-semibold tracking-[0.01em] text-white/90">
Basin Terrace Index
</span>
</div>
<div className="rounded-[14px] border border-white/14 bg-gradient-to-br from-[#14141c]/75 to-[#08080c]/65 px-[15px] py-[13px] shadow-[0_14px_36px_rgba(0,0,0,0.85),inset_0_1px_0_rgba(255,255,255,0.07)] backdrop-blur-md transition-all duration-200 group-hover:-translate-y-0.5 group-hover:border-[#d4a338]/65 group-hover:shadow-[0_18px_40px_rgba(0,0,0,0.92),0_0_24px_rgba(200,100,40,0.22)]">
<div className="flex items-baseline gap-2.5">
<span className="text-[21px] font-bold leading-[1.1] text-white">10.26</span>
<span className="rounded-md bg-[#2e7d32]/30 px-[7px] py-[2px] text-[11px] font-bold text-[#81c784]">
+31%
</span>
</div>
<p className="mt-1.5 text-[10.5px] leading-[1.45] text-slate-200/75">
Relative relief index • Base elevation {formatNum(st6.base)} m
</p>
</div>
</div>
{/* CARD 3: STA 10+00 */}
<div
onClick={() => handlePinStation(10)}
style={{ left: '77.5%', top: '13%' }}
className="group absolute z-15 hidden w-[245px] cursor-pointer transition-all duration-200 md:block"
>
<div className="-ml-[18px] mb-1.5 flex items-center">
<span className="h-[7px] w-[7px] flex-shrink-0 rounded-full bg-white shadow-[0_0_10px_rgba(255,255,255,0.9)]" />
<span className="h-px w-[18px] flex-shrink-0 bg-white/60" />
<span className="ml-2 whitespace-nowrap text-[11.5px] font-semibold tracking-[0.01em] text-white/90">
Eastern Summit Peak
</span>
</div>
<div className="rounded-[14px] border border-white/14 bg-gradient-to-br from-[#14141c]/75 to-[#08080c]/65 px-[15px] py-[13px] shadow-[0_14px_36px_rgba(0,0,0,0.85),inset_0_1px_0_rgba(255,255,255,0.07)] backdrop-blur-md transition-all duration-200 group-hover:-translate-y-0.5 group-hover:border-[#d4a338]/65 group-hover:shadow-[0_18px_40px_rgba(0,0,0,0.92),0_0_24px_rgba(200,100,40,0.22)]">
<div className="flex items-baseline gap-2.5">
<span className="text-[21px] font-bold leading-[1.1] text-white">
{formatNum(st10.base, 1)} m
</span>
<span className="rounded-md bg-[#d4a338]/25 px-[7px] py-[2px] text-[11px] font-bold text-[#ebd08b]">
+5%
</span>
</div>
<p className="mt-1.5 text-[10.5px] leading-[1.45] text-slate-200/75">
Terminal summit peak • Slope grade {st10.slope > 0 ? '+' : ''}
{formatNum(st10.slope)}%
</p>
</div>
</div>
</>
)}
{/* CROSSHAIR HOVER TOOLTIP */}
{hoveredStation && hoveredIdx !== null && (
<div
style={{ left: `${tooltipPos.x}px`, top: `${tooltipPos.y}px` }}
className="pointer-events-none absolute z-30 w-[248px] rounded-2xl border border-white/16 bg-gradient-to-br from-[#101018]/95 to-[#06060a]/96 px-[15px] py-[13px] text-xs shadow-[0_20px_45px_rgba(0,0,0,0.95)] backdrop-blur-md transition-opacity duration-150"
>
<div className="mb-1.5 flex items-center justify-between border-b border-white/10 pb-1.5">
<div className="flex items-center gap-2">
<span
className="h-2 w-2 rounded-full"
style={{
backgroundColor:
hoveredIdx <= 3 ? '#2e7d32' : hoveredIdx <= 7 ? '#d4a338' : '#c86428',
}}
/>
<span className="font-bold text-white">{hoveredStation.sta}</span>
</div>
<span className="text-[11px] text-slate-300/50">
{hoveredStation.dist.toLocaleString('en-US')} m
</span>
</div>
<div className="mb-2 text-[11.5px] font-semibold text-[#ebd08b]">
{hoveredStation.morph}
</div>
<div className="grid grid-cols-[1fr_auto] gap-x-2.5 gap-y-1 text-[11px]">
<span className="text-slate-200/75">Base Elevation:</span>
<span className="text-right font-semibold tabular-nums text-white">
{formatNum(hoveredStation.base)} m
</span>
<span className="text-slate-200/75">Contour Crest:</span>
<span className="text-right font-semibold tabular-nums text-white">
{formatNum(hoveredStation.top)} m
</span>
<span className="text-slate-200/75">Stratum Thickness:</span>
<span className="text-right font-semibold tabular-nums text-white">
{formatNum(hoveredStation.top - hoveredStation.base)} m
</span>
<span className="text-slate-200/75">Slope Grade:</span>
<span
className="text-right font-semibold tabular-nums"
style={{
color:
hoveredStation.slope > 0
? '#81c784'
: hoveredStation.slope < 0
? '#f0a875'
: '#e2e4f0',
}}
>
{hoveredStation.slope > 0 ? '+' : ''}
{formatNum(hoveredStation.slope)}%
</span>
</div>
</div>
)}
</div>
{/* RESPONSIVE MOBILE ANNOTATION CARDS (< 768px) */}
{showAnnotations && (
<div className="grid grid-cols-1 gap-2.5 px-4 pt-3 pb-[76px] sm:grid-cols-3 md:hidden">
<div
onClick={() => handlePinStation(2)}
className="cursor-pointer rounded-xl border border-white/14 bg-gradient-to-br from-[#14141c]/80 to-[#08080c]/75 p-3 transition-transform hover:-translate-y-0.5"
>
<div className="text-[11px] font-semibold text-[#f0a875]">Local Ridge Crest I</div>
<div className="mt-1 flex items-baseline gap-2.5">
<span className="text-lg font-bold text-white">{formatNum(st2.base)} m</span>
<span className="rounded-md bg-[#c86428]/25 px-1.5 py-0.5 text-[11px] font-bold text-[#f0a875]">
-14%
</span>
</div>
<p className="mt-1.5 text-[10.5px] leading-[1.45] text-slate-200/75">
Primary crest elevation • Stratum thickness {formatNum(st2.top - st2.base)} m
</p>
</div>
<div
onClick={() => handlePinStation(6)}
className="cursor-pointer rounded-xl border border-white/14 bg-gradient-to-br from-[#14141c]/80 to-[#08080c]/75 p-3 transition-transform hover:-translate-y-0.5"
>
<div className="text-[11px] font-semibold text-[#81c784]">Basin Terrace Index</div>
<div className="mt-1 flex items-baseline gap-2.5">
<span className="text-lg font-bold text-white">10.26</span>
<span className="rounded-md bg-[#2e7d32]/30 px-1.5 py-0.5 text-[11px] font-bold text-[#81c784]">
+31%
</span>
</div>
<p className="mt-1.5 text-[10.5px] leading-[1.45] text-slate-200/75">
Relative relief index • Base elevation {formatNum(st6.base)} m
</p>
</div>
<div
onClick={() => handlePinStation(10)}
className="cursor-pointer rounded-xl border border-white/14 bg-gradient-to-br from-[#14141c]/80 to-[#08080c]/75 p-3 transition-transform hover:-translate-y-0.5"
>
<div className="text-[11px] font-semibold text-[#ebd08b]">Eastern Summit Peak</div>
<div className="mt-1 flex items-baseline gap-2.5">
<span className="text-lg font-bold text-white">{formatNum(st10.base, 1)} m</span>
<span className="rounded-md bg-[#d4a338]/25 px-1.5 py-0.5 text-[11px] font-bold text-[#ebd08b]">
+5%
</span>
</div>
<p className="mt-1.5 text-[10.5px] leading-[1.45] text-slate-200/75">
Terminal summit peak • Slope grade {st10.slope > 0 ? '+' : ''}
{formatNum(st10.slope)}%
</p>
</div>
</div>
)}
</section>
{/* BOTTOM FLOATING CONTROL BAR */}
<div className="fixed bottom-4 left-1/2 z-35 max-w-[95vw] -translate-x-1/2">
<div className="flex items-center gap-3.5 rounded-full border border-white/15 bg-[#0e0e14]/90 px-[18px] py-2 text-xs shadow-[0_16px_40px_rgba(0,0,0,0.9)] backdrop-blur-md">
<button
type="button"
onClick={() => setShowAnnotations((v) => !v)}
className="inline-flex cursor-pointer items-center gap-1.5 whitespace-nowrap py-1 font-medium text-white transition-colors hover:text-[#ffbe3b]"
>
<span
style={{ opacity: showAnnotations ? 1 : 0.25 }}
className="h-2 w-2 rounded-full bg-gradient-to-br from-[#2e7d32] via-[#d4a338] to-[#c86428] transition-opacity"
/>
<span>Annotations</span>
</button>
<span className="h-[15px] w-px bg-white/15" />
<button
type="button"
onClick={() => setShowStations((v) => !v)}
className="inline-flex cursor-pointer items-center gap-1.5 whitespace-nowrap py-1 font-medium text-white transition-colors hover:text-[#ffbe3b]"
>
<span
style={{ opacity: showStations ? 1 : 0.25 }}
className="h-2 w-2 rounded-full bg-gradient-to-br from-[#2e7d32] via-[#d4a338] to-[#c86428] transition-opacity"
/>
<span>Stations</span>
</button>
<span className="hidden h-[15px] w-px bg-white/15 sm:block" />
<div className="hidden items-center gap-2 whitespace-nowrap text-slate-200/75 sm:flex">
<span>Strata:</span>
<input
type="range"
min={4}
max={10}
value={layers}
onChange={(e) => setLayers(parseInt(e.target.value, 10) || 8)}
className="h-1 w-[76px] cursor-pointer appearance-none rounded-full bg-white/20 accent-[#d4a338] outline-none"
/>
<span className="min-w-[18px] text-center font-bold tabular-nums text-[#ebd08b]">
{layers}
</span>
</div>
<span className="h-[15px] w-px bg-white/15" />
<button
type="button"
onClick={() => setIsTableOpen(true)}
className="inline-flex cursor-pointer items-center gap-1.5 whitespace-nowrap rounded-full bg-gradient-to-r from-[#1b5e20] via-[#689f38] via-50% to-[#c86428] px-3.5 py-1.5 font-semibold text-white shadow-[0_4px_16px_rgba(104,159,56,0.28)] transition-all hover:-translate-y-0.5 hover:opacity-95"
>
<svg
width="14"
height="14"
viewBox="0 0 24 24"
fill="none"
stroke="currentColor"
strokeWidth="2"
strokeLinecap="round"
strokeLinejoin="round"
>
<rect x="3" y="3" width="18" height="18" rx="2" />
<line x1="3" y1="9" x2="21" y2="9" />
<line x1="3" y1="15" x2="21" y2="15" />
<line x1="9" y1="9" x2="9" y2="21" />
</svg>
<span>Data Table</span>
</button>
</div>
</div>
{/* TOPOGRAPHIC DATA TABLE MODAL (11 STATIONS) */}
{isTableOpen && (
<div
onClick={(e) => {
if (e.target === e.currentTarget) setIsTableOpen(false);
}}
className="fixed inset-0 z-50 flex items-center justify-center bg-black/85 p-3 sm:p-5 backdrop-blur-md"
>
<div className="flex max-h-[90vh] w-full max-w-[1040px] flex-col overflow-hidden rounded-2xl border border-white/15 bg-gradient-to-br from-[#12121a]/98 to-[#07070b]/98 shadow-[0_28px_70px_rgba(0,0,0,0.98)]">
{/* Modal Header */}
<div className="flex flex-wrap items-center justify-between gap-4 border-b border-white/10 px-5 py-4 sm:px-6">
<div>
<div className="flex items-center gap-2.5">
<span className="h-2.5 w-2.5 rounded-full bg-gradient-to-r from-[#2e7d32] via-[#d4a338] to-[#c86428]" />
<h2 className="text-base font-bold tracking-tight text-white">
Topographic Survey Dataset • STA 0+00 – STA 10+00
</h2>
</div>
<p className="mt-1 text-xs text-slate-300/60">
Click any station row to pin it on the chart, or edit elevation fields inline for live contour updates.
</p>
</div>
<div className="flex items-center gap-2">
<button
type="button"
onClick={handleResetDataset}
className="inline-flex cursor-pointer items-center gap-1.5 rounded-xl border border-white/14 bg-white/[0.05] px-3 py-2 text-xs font-medium text-slate-200 transition-colors hover:bg-white/[0.12] hover:text-white"
>
<svg
width="13"
height="13"
viewBox="0 0 24 24"
fill="none"
stroke="currentColor"
strokeWidth="2"
strokeLinecap="round"
strokeLinejoin="round"
>
<path d="M3 12a9 9 0 1 0 9-9 9.75 9.75 0 0 0-6.74 2.74L3 8" />
<path d="M3 3v5h5" />
</svg>
<span>Reset</span>
</button>
<button
type="button"
onClick={handleDownloadCsv}
className="inline-flex cursor-pointer items-center gap-1.5 rounded-xl bg-gradient-to-r from-[#1b5e20] via-[#689f38] to-[#c86428] px-3.5 py-2 text-xs font-semibold text-white shadow-[0_4px_14px_rgba(104,159,56,0.28)] transition-opacity hover:opacity-90"
>
<svg
width="14"
height="14"
viewBox="0 0 24 24"
fill="none"
stroke="currentColor"
strokeWidth="2"
strokeLinecap="round"
strokeLinejoin="round"
>
<path d="M21 15v4a2 2 0 0 1-2 2H5a2 2 0 0 1-2-2v-4" />
<polyline points="7 10 12 15 17 10" />
<line x1="12" y1="15" x2="12" y2="3" />
</svg>
<span>Export CSV</span>
</button>
<button
type="button"
onClick={() => setIsTableOpen(false)}
aria-label="Close Modal"
className="inline-flex h-[34px] w-[34px] cursor-pointer items-center justify-center rounded-xl border border-white/12 bg-white/8 text-base text-white transition-colors hover:bg-white/16"
>
×
</button>
</div>
</div>
{/* Summary Metrics Strip */}
<div className="grid grid-cols-2 gap-2.5 border-b border-white/10 bg-white/[0.02] px-5 py-3 sm:grid-cols-4 sm:px-6">
<div className="rounded-xl border border-white/8 bg-[#0b0b10]/90 px-3.5 py-2.5">
<div className="text-[10.5px] font-medium uppercase tracking-wider text-slate-400">
Min Base Elevation
</div>
<div className="mt-0.5 text-sm font-bold tabular-nums text-[#81c784]">
{formatNum(minElev)} m
</div>
</div>
<div className="rounded-xl border border-white/8 bg-[#0b0b10]/90 px-3.5 py-2.5">
<div className="text-[10.5px] font-medium uppercase tracking-wider text-slate-400">
Max Summit Elevation
</div>
<div className="mt-0.5 text-sm font-bold tabular-nums text-[#f0a875]">
{formatNum(maxElev)} m
</div>
</div>
<div className="rounded-xl border border-white/8 bg-[#0b0b10]/90 px-3.5 py-2.5">
<div className="text-[10.5px] font-medium uppercase tracking-wider text-slate-400">
Mean Elevation
</div>
<div className="mt-0.5 text-sm font-bold tabular-nums text-[#ebd08b]">
{formatNum(avgElev)} m
</div>
</div>
<div className="rounded-xl border border-white/8 bg-[#0b0b10]/90 px-3.5 py-2.5">
<div className="text-[10.5px] font-medium uppercase tracking-wider text-slate-400">
Max Stratum Thickness
</div>
<div className="mt-0.5 text-sm font-bold tabular-nums text-white">
{formatNum(maxThickness)} m
</div>
</div>
</div>
{/* Filter & Search Toolbar */}
<div className="flex flex-wrap items-center justify-between gap-3 border-b border-white/10 bg-[#0a0a0f]/75 px-5 py-2.5 sm:px-6">
<div className="relative flex-1 min-w-[200px] max-w-xs">
<svg
className="pointer-events-none absolute top-1/2 left-3 -translate-y-1/2 text-slate-400"
width="13"
height="13"
viewBox="0 0 24 24"
fill="none"
stroke="currentColor"
strokeWidth="2"
strokeLinecap="round"
strokeLinejoin="round"
>
<circle cx="11" cy="11" r="8" />
<line x1="21" y1="21" x2="16.65" y2="16.65" />
</svg>
<input
type="text"
value={searchQuery}
onChange={(e) => setSearchQuery(e.target.value)}
placeholder="Search station or landform..."
className="w-full rounded-lg border border-white/12 bg-white/[0.05] py-1.5 pr-3 pl-8 text-xs text-white placeholder-slate-400/70 outline-none transition-colors focus:border-[#d4a338]"
/>
</div>
<div className="flex items-center gap-1.5 text-xs">
<span className="mr-1 hidden text-[11px] text-slate-400 sm:inline">Grade:</span>
{(['all', 'ascending', 'descending'] as const).map((mode) => (
<button
key={mode}
type="button"
onClick={() => setSlopeFilter(mode)}
className={`cursor-pointer rounded-lg px-2.5 py-1 text-[11px] font-medium capitalize transition-colors ${
slopeFilter === mode
? 'bg-[#d4a338]/25 text-[#ebd08b] border border-[#d4a338]/45'
: 'border border-white/10 bg-white/[0.04] text-slate-300 hover:bg-white/[0.09]'
}`}
>
{mode}
</button>
))}
</div>
</div>
{/* Table Content */}
<div className="flex-1 overflow-auto">
<table className="w-full border-collapse text-left text-[12.5px]">
<thead>
<tr>
<th className="sticky top-0 z-10 whitespace-nowrap border-b border-white/14 bg-[#0d0d14] px-4 py-3 text-[11px] font-semibold uppercase tracking-wider text-slate-300/80">
Station
</th>
<th className="sticky top-0 z-10 whitespace-nowrap border-b border-white/14 bg-[#0d0d14] px-4 py-3 text-right text-[11px] font-semibold uppercase tracking-wider text-slate-300/80">
Distance (m)
</th>
<th className="sticky top-0 z-10 whitespace-nowrap border-b border-white/14 bg-[#0d0d14] px-4 py-3 text-right text-[11px] font-semibold uppercase tracking-wider text-slate-300/80">
Base Elev. (m)
</th>
<th className="sticky top-0 z-10 whitespace-nowrap border-b border-white/14 bg-[#0d0d14] px-4 py-3 text-right text-[11px] font-semibold uppercase tracking-wider text-slate-300/80">
Contour Crest (m)
</th>
<th className="sticky top-0 z-10 whitespace-nowrap border-b border-white/14 bg-[#0d0d14] px-4 py-3 text-right text-[11px] font-semibold uppercase tracking-wider text-slate-300/80">
Thickness (m)
</th>
<th className="sticky top-0 z-10 whitespace-nowrap border-b border-white/14 bg-[#0d0d14] px-4 py-3 text-right text-[11px] font-semibold uppercase tracking-wider text-slate-300/80">
Slope (%)
</th>
<th className="sticky top-0 z-10 whitespace-nowrap border-b border-white/14 bg-[#0d0d14] px-4 py-3 text-[11px] font-semibold uppercase tracking-wider text-slate-300/80">
Hypsometric Zone
</th>
<th className="sticky top-0 z-10 whitespace-nowrap border-b border-white/14 bg-[#0d0d14] px-4 py-3 text-[11px] font-semibold uppercase tracking-wider text-slate-300/80">
Landform / Morphology
</th>
</tr>
</thead>
<tbody className="divide-y divide-white/[0.06]">
{filteredStations.length === 0 ? (
<tr>
<td colSpan={8} className="px-4 py-10 text-center text-xs text-slate-400">
No survey stations match your current filter.
</td>
</tr>
) : (
filteredStations.map(({ st, idx }) => {
const thickness = st.top - st.base;
const isPinned = pinnedIdx === idx;
const zone = getSoilZoneBadge(st.base);
const slopeBadge =
st.slope > 0
? 'bg-[#2e7d32]/25 text-[#81c784] border-[#2e7d32]/40'
: st.slope < 0
? 'bg-[#c86428]/25 text-[#f0a875] border-[#c86428]/40'
: 'bg-white/8 text-slate-300 border-white/12';
return (
<tr
key={st.sta}
className={`transition-colors hover:bg-white/[0.045] ${
isPinned
? 'bg-gradient-to-r from-[#2e7d32]/25 via-[#d4a338]/12 to-transparent'
: idx % 2 === 1
? 'bg-white/[0.015]'
: ''
}`}
>
<td
onClick={() => handlePinStation(idx)}
title="Click to pin/unpin station on chart"
className="cursor-pointer whitespace-nowrap px-4 py-2.5 font-bold text-white"
>
<div className="flex items-center gap-2">
<span
style={{
backgroundColor: isPinned ? '#d4a338' : zone.dot,
}}
className={`inline-block h-2 w-2 rounded-full ${
isPinned ? 'ring-2 ring-[#d4a338]/40' : ''
}`}
/>
<span>{st.sta}</span>
{isPinned && (
<span className="rounded bg-[#d4a338]/25 px-1.5 py-0.5 text-[9.5px] font-semibold uppercase tracking-wide text-[#ebd08b]">
Pinned
</span>
)}
</div>
</td>
<td className="whitespace-nowrap px-4 py-2.5 text-right tabular-nums text-slate-300/75">
{st.dist.toLocaleString('en-US')}
</td>
<td className="whitespace-nowrap px-4 py-2.5 text-right tabular-nums">
<input
type="number"
step="0.1"
min={0}
max={130}
value={st.base}
onChange={(e) => handleElevationEdit(idx, 'base', e.target.value)}
className="w-[80px] rounded-lg border border-white/15 bg-[#161620] px-2.5 py-1 text-right text-xs font-semibold text-white transition-colors outline-none hover:border-white/30 focus:border-[#d4a338] focus:bg-[#d4a338]/15"
/>
</td>
<td className="whitespace-nowrap px-4 py-2.5 text-right tabular-nums">
<input
type="number"
step="0.1"
min={0}
max={130}
value={st.top}
onChange={(e) => handleElevationEdit(idx, 'top', e.target.value)}
className="w-[80px] rounded-lg border border-white/15 bg-[#161620] px-2.5 py-1 text-right text-xs font-semibold text-white transition-colors outline-none hover:border-white/30 focus:border-[#d4a338] focus:bg-[#d4a338]/15"
/>
</td>
<td className="whitespace-nowrap px-4 py-2.5 text-right tabular-nums font-medium text-slate-200">
{formatNum(thickness)}
</td>
<td className="whitespace-nowrap px-4 py-2.5 text-right tabular-nums">
<span
className={`inline-block rounded-md border px-2 py-0.5 text-[11px] font-semibold ${slopeBadge}`}
>
{st.slope > 0 ? '+' : ''}
{formatNum(st.slope)}%
</span>
</td>
<td className="whitespace-nowrap px-4 py-2.5">
<span
className={`inline-flex items-center gap-1.5 rounded-full border px-2.5 py-0.5 text-[11px] font-medium ${zone.cls}`}
>
<span
className="h-1.5 w-1.5 rounded-full"
style={{ backgroundColor: zone.dot }}
/>
{zone.label}
</span>
</td>
<td className="whitespace-nowrap px-4 py-2.5 text-slate-200/90">
{st.morph}
</td>
</tr>
);
})
)}
</tbody>
</table>
</div>
{/* Modal Footer */}
<div className="flex flex-wrap items-center justify-between gap-2 border-t border-white/10 bg-[#0a0a0f]/90 px-5 py-2.5 text-[11px] text-slate-400 sm:px-6">
<span>
Showing <strong className="text-slate-200">{filteredStations.length}</strong> of{' '}
<strong className="text-slate-200">{stations.length}</strong> survey stations
</span>
<span>Interval spacing: 100 m • Datum: Mean Sea Level (MSL)</span>
</div>
</div>
</div>
)}
{/* NOTIFICATION TOAST */}
{toastMsg && (
<div className="pointer-events-none fixed top-[22px] left-1/2 z-60 -translate-x-1/2 rounded-full border border-white/16 bg-[#12121a]/95 px-4 py-2 text-xs font-medium text-white shadow-[0_12px_30px_rgba(0,0,0,0.85)]">
{toastMsg}
</div>
)}
</div>
);
}More by pstzx
View all
Button Payment
109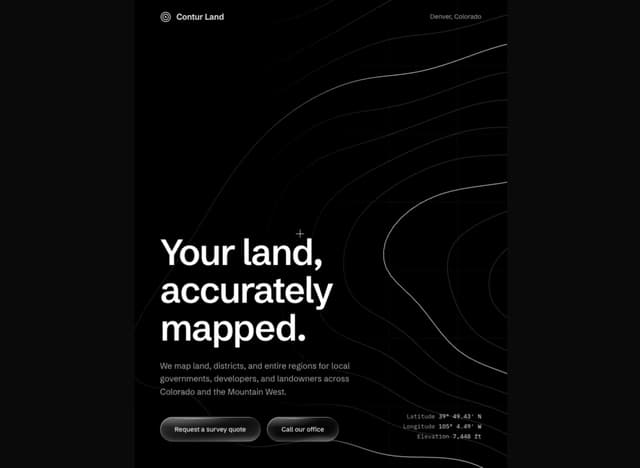
Contour Land Map
29
Sign In Water Effect Glass
26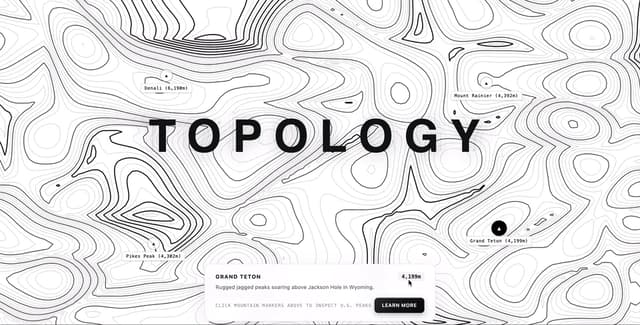
Contour line Mountain
22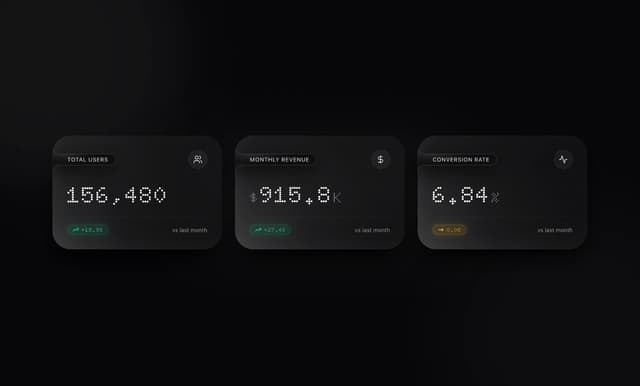
Card Dashboard Analytic
12
Loading Screen Glass
12
21 st Contour Line
12
Contour line map
11