
About
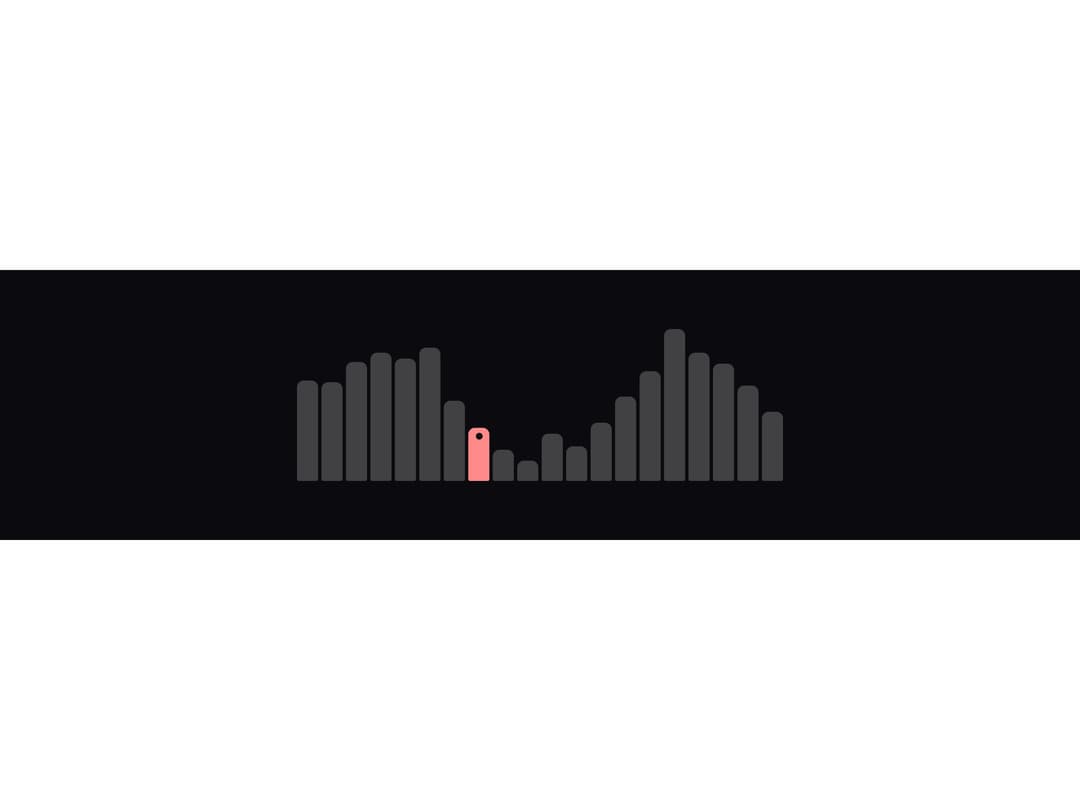
A simple grid of vertical bars for comparing a handful of values side by side, with an optional colored "tone" to call out one bar and a dot marker to flag an event — ported to React from the oyna-ui Vue component by azabroflovski.
Built with React and Tailwind. Copy the prompt and paste it into Claude Code, Cursor or Lovable: your agent adds Bar Chart to your project and fits it to your theme.
Code
How Bar Chart is used: the demo's code. The component's own source comes with a free account.
Usage.tsx
import BarChart from "@/components/ui/bar-chart";

const days = Array.from({ length: 20 }, (_, i) => ({
  label: `Day ${i + 1}`,
  value: Math.round(40 + Math.sin(i / 2) * 30 + (i % 5 === 0 ? 15 : 0)),
  tone: i === 7 ? ("danger" as const) : undefined,
  dot: i === 7,
}));

export default function BarChartDenseDemo() {
  return (
    <div className="flex min-h-[320px] w-full items-center justify-center bg-[#0b0b0f] p-10">
      <div className="w-full max-w-xl">
        <BarChart items={days} />
      </div>
    </div>
  );
}
More by azabroflovski
View all
Select
Dialog
Switch

Checkbox
Card