
About
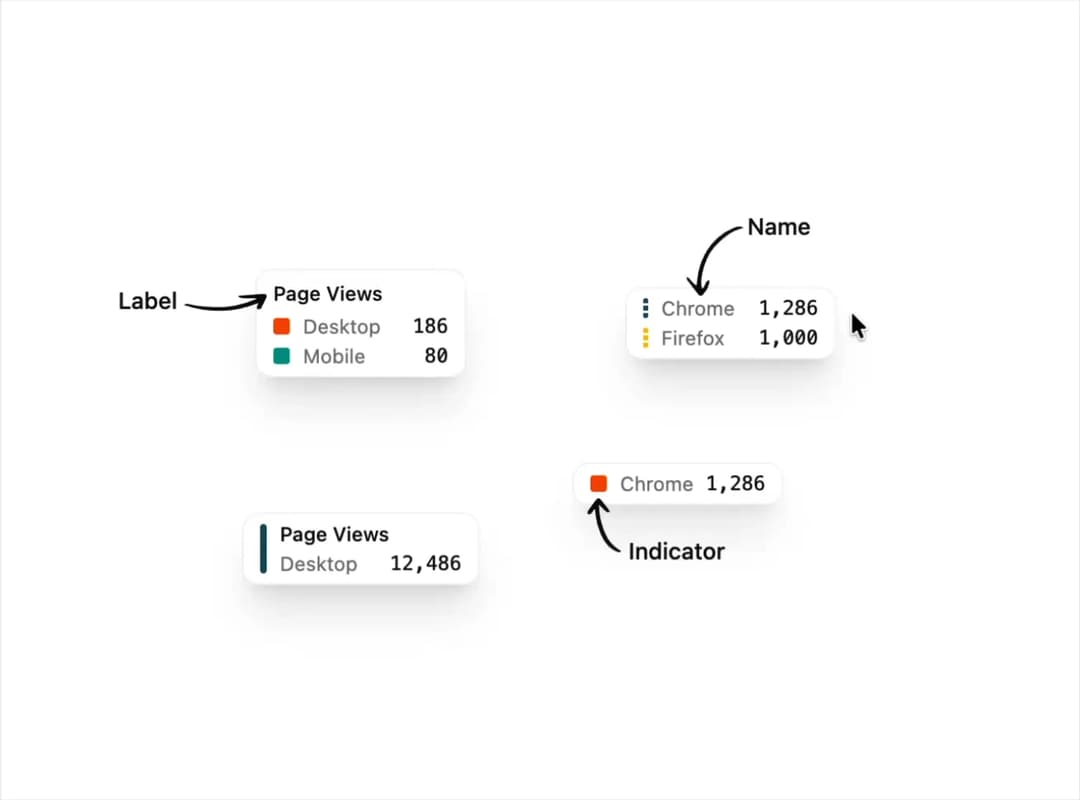
A styled tooltip content block for data charts that shows labeled values with colored dot, line, or dashed indicators next to each series.
Built with React and Tailwind. Copy the prompt and paste it into Claude Code, Cursor or Lovable: your agent adds Chart Tooltip to your project and fits it to your theme.
Code
How Chart Tooltip is used: the demo's code. The component's own source comes with a free account.
Usage.tsx
import ChartTooltip from "@/components/ui/chart-tooltip";

export default function ChartTooltipDemoUsage() {
  return <ChartTooltip />;
}
More by uiable
View all

Feature Highlights Grid
436
Card Tabs
117
Financial Bento Grid
98
Portfolio Showcase Grid
75
Marketing Hero Section
73
Sidebar with Search and Profile
61
Attachment States
48
Position Sonner
48
More in Dashboards
View all
Dashboard with Collapsible Sidebar
2.5K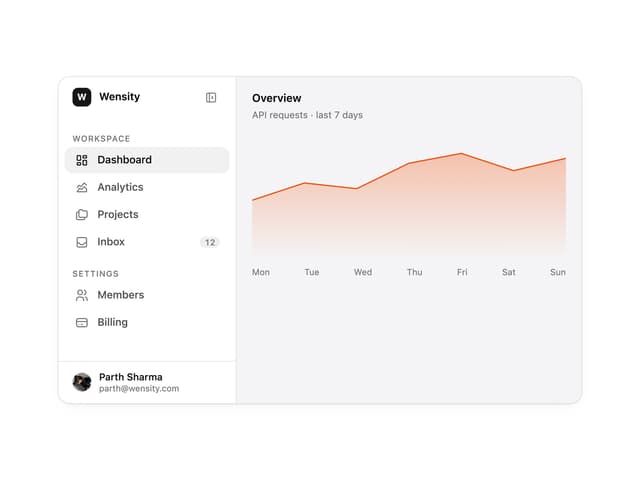

Sidebar
329

SaaS Template
2.5K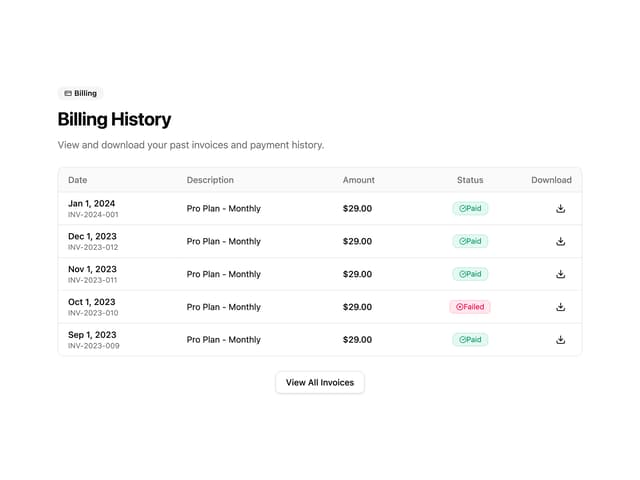

Invoice History Table
82

Card
228
Stats Bento
1.2K

Course Design Cards
1.2K

Data Grid Table
15

