
About
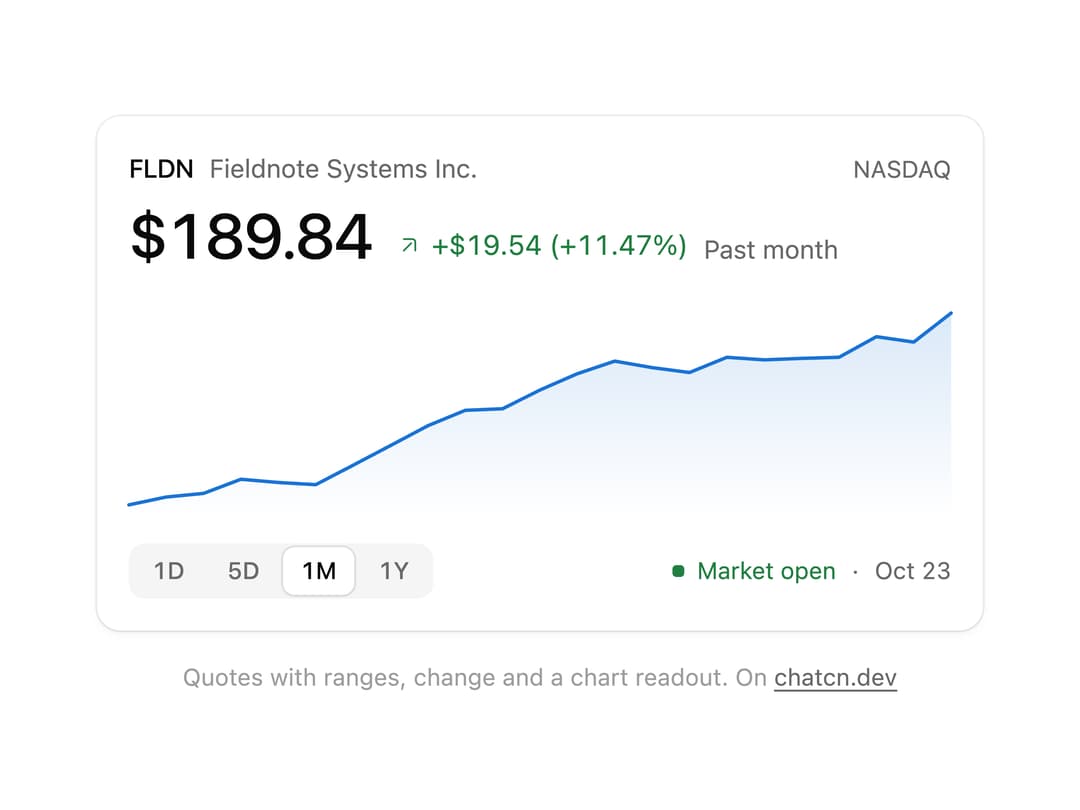
A quote card for assistant replies: price, change against the start of the range with its tone, a chart with a crosshair readout, range tabs and market state. Shown with a fictional stock and coin.
Built with React and Tailwind. Copy the prompt and paste it into Claude Code, Cursor or Lovable: your agent adds Ticker Card to your project and fits it to your theme.
Code
How Ticker Card is used: the demo's code. The component's own source comes with a free account.
Usage.tsx
"use client"

import * as React from "react"
import { TickerCard } from "@/components/ui/ticker-card"

const reducedMotion = () =>
  typeof window !== "undefined" && window.matchMedia("(prefers-reduced-motion: reduce)").matches

/** How long a choice holds a tour before it carries on. */
const RESUME_MS = 1800

/**
 * Steps through `values` on a timer, so a 21st preview (and its cover video) shows every option
 * without a click. Picking a value holds it, and the tour carries on from there after
 * `RESUME_MS`, so a click never leaves the preview still. Reduced motion never starts it.
 */
function useCycle<T>(values: readonly T[], ms: number) {
  const [index, setIndex] = React.useState(0)
  const [heldAt, setHeldAt] = React.useState(0)
  React.useEffect(() => {
    if (reducedMotion()) return
    let id = 0
    const start = () => {
      id = window.setInterval(() => setIndex((n) => (n + 1) % values.length), ms)
    }
    const wait = window.setTimeout(start, heldAt ? RESUME_MS : 0)
    return () => {
      window.clearTimeout(wait)
      window.clearInterval(id)
    }
  }, [heldAt, values.length, ms])
  const pick = React.useCallback(
    (value: T) => {
      setHeldAt(Date.now())
      setIndex(Math.max(0, values.indexOf(value)))
    },
    [values],
  )
  return [values[index] as T, pick] as const
}

/**
 * The tour: a fictional stock through its ranges, then a fictional coin. Each view changes the
 * chart, the change figure and its tone. Names are made up, so no real market is quoted.
 */
const VIEWS = [
  { kind: "stock", range: "1D" },
  { kind: "stock", range: "1M" },
  { kind: "stock", range: "1Y" },
  { kind: "coin", range: "24H" },
  { kind: "coin", range: "1M" },
  { kind: "coin", range: "1Y" },
] as const

/**
 * Static, made-up price series for the ticker card examples. Generated from a seeded walk so
 * screenshots never change.
 */
function walk(seed: number, n: number, start: number, drift: number, vol: number) {
  let s = seed
  const rand = () => {
    s = (s * 16807) % 2147483647
    return s / 2147483647
  }
  const out: number[] = []
  let v = start
  for (let i = 0; i < n; i++) {
    v = Math.max(0.01, v + drift + (rand() - 0.5) * vol)
    out.push(Math.round(v * 100) / 100)
  }
  return out
}

const label = (values: number[], labels: string[]) =>
  values.map((v, i) => ({ t: labels[i] ?? "", v }))

const times = (n: number) =>
  Array.from({ length: n }, (_, i) => {
    const m = 9 * 60 + 30 + i * 5
    return `${String(Math.floor(m / 60)).padStart(2, "0")}:${String(m % 60).padStart(2, "0")}`
  })

const end = new Date("2026-10-23T12:00:00Z")

const days = (n: number, end: Date, step: number) =>
  Array.from({ length: n }, (_, i) => {
    const d = new Date(end.getTime() - (n - 1 - i) * step * 86_400_000)
    return d.toLocaleDateString("en-US", { month: "short", day: "numeric" })
  })

const stockSeries = (() => {
  const d1 = walk(7, 79, 186.2, 0.04, 1.1)
  d1[d1.length - 1] = 189.84
  return {
    "1D": label(d1, times(79)),
    "5D": label(walk(11, 60, 181, 0.15, 1.6).concat([189.84]), days(61, end, 5 / 61)),
    "1M": label(walk(19, 22, 171, 0.8, 3).concat([189.84]), days(23, end, 30 / 23)),
    "1Y": label(walk(23, 52, 142, 0.9, 6).concat([189.84]), days(53, end, 7)),
  }
})()

const cryptoSeries = {
  "24H": label(walk(5, 96, 67_420, -14, 260), times(96)),
  "7D": label(walk(9, 84, 69_900, -38, 520), days(84, end, 7 / 84)),
  "1M": label(walk(13, 30, 61_200, 210, 1400), days(30, end, 1)),
  "1Y": label(walk(29, 52, 38_400, 560, 2600), days(52, end, 7)),
}

type Point = { t: string; v: number }

const FIT_CSS = "html,body{overflow:hidden}[data-fit-small] [data-fit-hide]{display:none!important}"

/**
 * 21st shows a demo in a small frame: about 674 by 421 on a component page, 358 by 224 on a
 * phone and 245 by 139 on a profile card. A demo taller than its frame gets scrollbars, which
 * render white on dark pages. FitFrame fills the frame exactly instead.
 *
 * - "scale": the content shrinks until it fits, centered. For visuals such as orbs.
 * - "crop": the content stays at full size from the top and fades out at the bottom. For text
 *   that streams in, where a changing scale would make the page breathe.
 *
 * `minWidth` lays out a wide demo (a table, a two column panel) at that width and scales it down
 * to the frame, instead of letting it collapse to a narrow layout. The frame centers it, so it
 * shrinks evenly on both sides.
 *
 * Anything marked `data-fit-hide` (state buttons, the chatcn.dev line) drops out in frames
 * shorter than `hideBelow`, so a profile card shows the visual alone.
 */
function FitFrame({
  children,
  mode = "scale",
  hideBelow = 360,
  minWidth,
}: {
  children: React.ReactNode
  mode?: "scale" | "crop"
  hideBelow?: number
  minWidth?: string
}) {
  const content = React.useRef<HTMLDivElement>(null)
  const [cropped, setCropped] = React.useState(false)

  React.useLayoutEffect(() => {
    const el = content.current
    if (!el) return
    const measure = () => {
      const vw = window.innerWidth
      const vh = window.innerHeight
      el.toggleAttribute("data-fit-small", vh < hideBelow)
      // Layout sizes ignore the transform, so measuring never feeds back.
      const w = Math.max(el.offsetWidth, el.scrollWidth)
      const h = Math.max(el.offsetHeight, el.scrollHeight)
      const scale = mode === "scale" ? Math.min(1, vw / w, vh / h) : 1
      el.style.transform = scale < 1 ? `scale(${scale})` : ""
      setCropped(mode === "crop" && h > vh + 1)
    }
    measure()
    const observer = new ResizeObserver(measure)
    observer.observe(el)
    // Content that changes inside a fixed width box (a headline that cycles words) never resizes
    // the box itself, so changes below it measure again on the next frame.
    let frame = 0
    const mutations = new MutationObserver(() => {
      cancelAnimationFrame(frame)
      frame = requestAnimationFrame(measure)
    })
    mutations.observe(el, { subtree: true, childList: true, characterData: true })
    window.addEventListener("resize", measure)
    return () => {
      observer.disconnect()
      mutations.disconnect()
      cancelAnimationFrame(frame)
      window.removeEventListener("resize", measure)
    }
  }, [mode, hideBelow])

  const fade = "linear-gradient(to bottom, #000 calc(100% - 40px), transparent)"
  return (
    <div
      className="flex w-full justify-center overflow-hidden"
      style={{
        height: "100dvh",
        alignItems: mode === "crop" ? "flex-start" : "center",
        maskImage: cropped ? fade : undefined,
        WebkitMaskImage: cropped ? fade : undefined,
      }}
    >
      <style>{FIT_CSS}</style>
      <div
        ref={content}
        className="w-full shrink-0"
        style={{ transformOrigin: mode === "crop" ? "top center" : "center", minWidth }}
      >
        {children}
      </div>
    </div>
  )
}

const first = (series: Point[] | undefined) => series?.[0]?.v ?? 0

const last = (series: Point[] | undefined) => series?.[series.length - 1]?.v ?? 0

/** The line under each 21st demo that points back to the kit. */
function MoreOn({ slug, children }: { slug: string; children: React.ReactNode }) {
  return (
    <p data-fit-hide className="text-[0.75rem]/[1rem] text-(color:--chatcn-fg-faint) text-center text-balance">
      {children}{" "}
      <a
        href={`https://chatcn.dev/docs/components/${slug}`}
        target="_blank"
        rel="noopener"
        className="text-(color:--chatcn-fg-subtle) hover:text-(color:--chatcn-fg) underline underline-offset-2"
      >
        chatcn.dev
      </a>
    </p>
  )
}

/**
 * A quote card an assistant answers a market question with: price, change against the open of
 * the range, a chart with a crosshair readout and market state. The demo walks a fictional stock
 * and a fictional coin through their ranges. Pick a range yourself and the tour waits a moment.
 */
export default function TickerCardPreview() {
  const [view, pick] = useCycle(VIEWS, 1700)
  const stock = view.kind === "stock"
  const series = stock ? stockSeries : cryptoSeries
  const points = (series as Record<string, Point[]>)[view.range]
  return (
    <FitFrame minWidth="30rem">
      <div className="flex w-full flex-col items-center justify-center gap-4 p-6">
        <div className="w-full max-w-md">
          {stock ? (
            <TickerCard
              symbol="FLDN"
              name="Fieldnote Systems Inc."
              exchange="NASDAQ"
              price={189.84}
              previousClose={view.range === "1D" ? 186.12 : first(points)}
              series={stockSeries}
              range={view.range}
              onRangeChange={(r) => pick(VIEWS.find((v) => v.kind === "stock" && v.range === r) ?? VIEWS[0])}
              market={{ state: "open", label: "Market open" }}
              updated="Oct 23"
            />
          ) : (
            <TickerCard
              symbol="ORBT"
              name="Orbit Token"
              exchange="Sample exchange"
              price={last(points)}
              previousClose={first(points)}
              series={cryptoSeries}
              ranges={["24H", "7D", "1M", "1Y"]}
              range={view.range}
              onRangeChange={(r) => pick(VIEWS.find((v) => v.kind === "coin" && v.range === r) ?? VIEWS[3])}
              market={{ state: "open", label: "Trading 24/7" }}
              updated="Oct 23"
            />
          )}
        </div>
        <MoreOn slug="ticker-card">Quotes with ranges, change and a chart readout. On</MoreOn>
      </div>
    </FitFrame>
  )
}
Dependencies
More by Aadi
View all
Dither Orb
12
Audio Visualizer
9
Voice Orb
8
Agent Lanes
6
Computer View
3
Waveform
2
Reasoning
2
Voice Session
1